
Introduction to the MTF Support and Resistance Indicator
Swing highs and swing lows can be considered as support and resistance levels considering that price has already reversed from such levels.
This indicator is based on the concept of using swing highs and swing lows for identifying support and resistance levels.
What is the MTF Support and Resistance Indicator?
MTF stands for “Multi Time Frame”. As the name suggests, the MTF Support and Resistance Indicator is a custom technical indicator which automatically identifies and indicates support and resistance levels based on multiple timeframes.
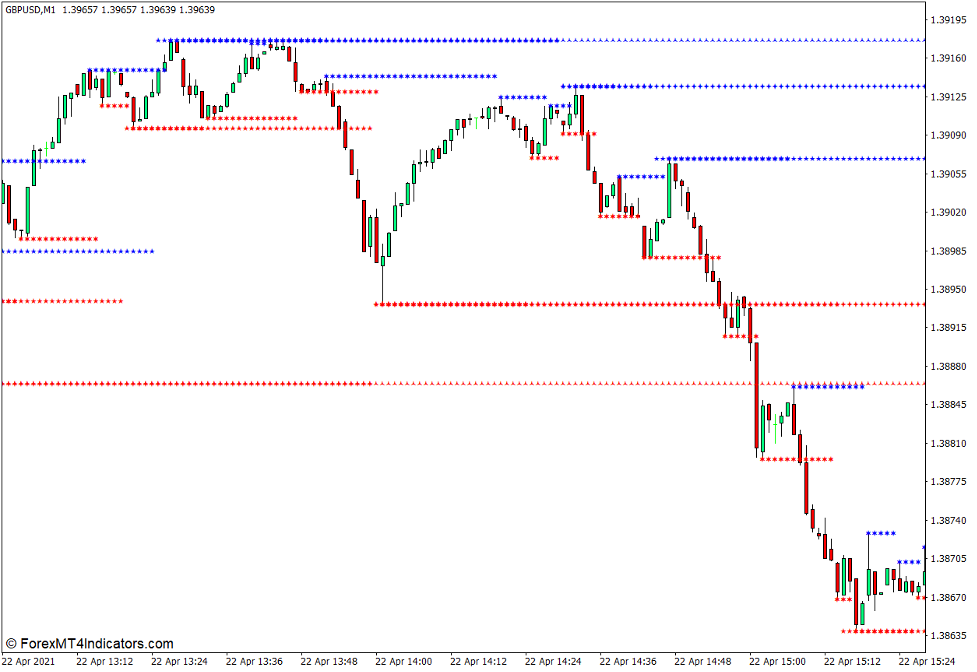
This indicator plots a series of characters that form a horizontal line to show support and resistance levels. Each type of character or symbol represents a time frame in which the horizontal support and resistance level is based on.
The color of the lines also indicates whether the level is a support or resistance level. Red lines indicate a support level, while blue lines indicate a resistance level.
How the MTF Support and Resistance Indicator Works
The MTF Support and Resistance Indicator uses a simple algorithm which detects the swing lows and swing highs of price action based on different timeframes. The timeframes are based on the number of minutes which the trader would use on the indicator’s input variables. It also allows for up to four timeframes used simultaneously to detect support and resistance levels.
It then uses the swing lows as a basis for the support levels. On the other hand, it also uses the swing highs as a basis for plotting the resistance levels.
The indicator then plots the series of symbols to form a horizontal line based on the identifies support and resistance levels.
How to use the MTF Support and Resistance Indicator for MT4
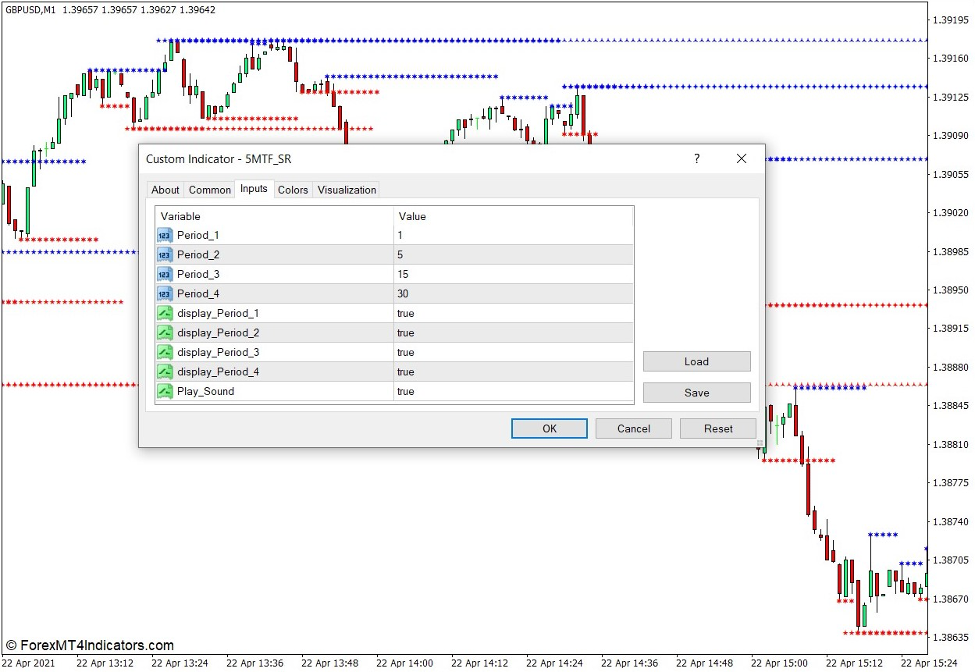
This indicator allows users to modify the timeframes used, as well as the number of timeframes used simultaneously to identify support and resistance levels. These modifications can be done within the indicator’s settings.
The “Period 1”, “Period 2”, “Period 3”, and “Period 4” variables are used to modify the timeframes used to identify the support and resistance levels. The input variable is in minutes. As such, users simply have to input the number of minutes for the timeframe used. This would mean that if you would like to use it for higher timeframes, then you would simply have to multiply the number of hours on the timeframe by 60.
The “Display Period 1”, “Display Period 2”, “Display Period 3”, and “Display Period 4” options toggles the display of “Period 1” up to “Period 4” on and off.
This support and resistance levels can be used as the usual support and resistance levels are used. Traders can trade trend reversal signals forming on these levels.
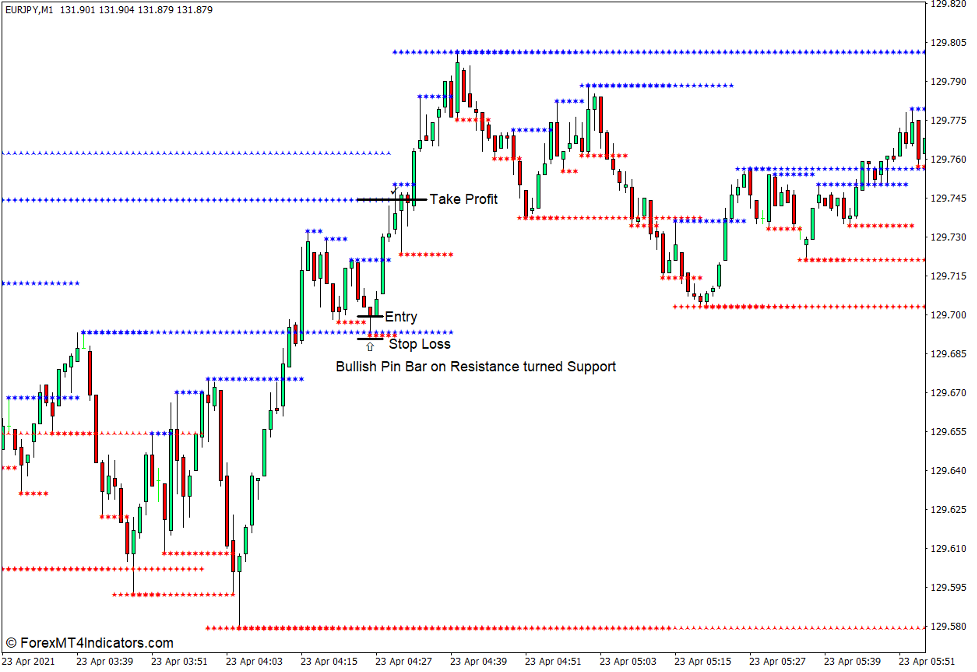
Note that broken resistance levels can act as support and vice versa.
Buy Trade Setup
When to Enter?
Open a buy order if a bullish signal forms on a support level.
When to Exit?
Set the take profit target on the next major resistance level.
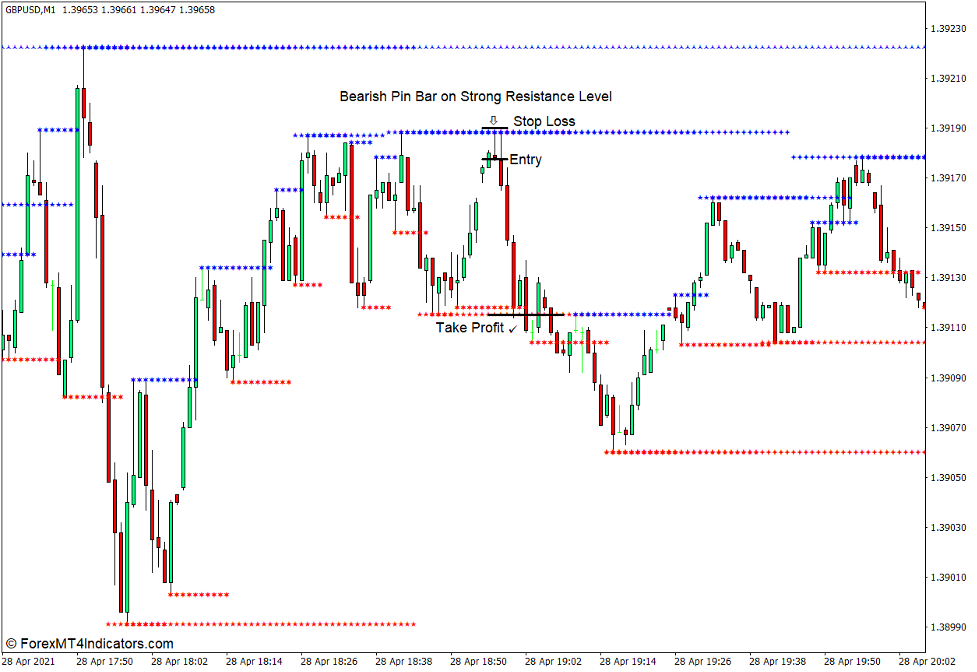
Sell Trade Setup
When to Enter?
Open a sell order if a bearish signal forms on a resistance level.
When to Exit?
Set the take profit target on the next major support level.
Conclusion
This indicator can be useful for strategies that use horizontal support and resistance levels, such as market flow types of strategies. However, it is best to use the major support and resistance levels as these levels tend to be more reliable. It is also best to use this indicator in conjunction with other technical indications for better reliability.
MT4 Indicators – Download Instructions
MTF Support and Resistance Indicator for MT4 is a Metatrader 4 (MT4) indicator and the essence of this technical indicator is to transform the accumulated history data.
MTF Support and Resistance Indicator for MT4 provides for an opportunity to detect various peculiarities and patterns in price dynamics which are invisible to the naked eye.
Based on this information, traders can assume further price movement and adjust their strategy accordingly. Click here for MT4 Strategies
Recommended Forex Metatrader 4 Trading Platform
- International broker with 24/7 support.
- Over 12,000 assets, including Stocks, Indices, Forex.
- Fastest order execution and spreads from 0 pips.
- Bonuses up to $50,000 starting from the first deposit.
- Demo accounts for testing trading strategies.

Click Here for Step By Step RoboForex Trading Account Opening Guide
How to install MTF Support and Resistance Indicator for MT4.mq4?
- Download MTF Support and Resistance Indicator for MT4.mq4
- Copy MTF Support and Resistance Indicator for MT4.mq4 to your Metatrader Directory / experts / indicators /
- Start or restart your Metatrader 4 Client
- Select Chart and Timeframe where you want to test your MT4 indicators
- Search “Custom Indicators” in your Navigator mostly left in your Metatrader 4 Client
- Right click on MTF Support and Resistance Indicator for MT4.mq4
- Attach to a chart
- Modify settings or press ok
- Indicator MTF Support and Resistance Indicator for MT4.mq4 is available on your Chart
How to remove MTF Support and Resistance Indicator for MT4.mq4 from your Metatrader Chart?
- Select the Chart where is the Indicator running in your Metatrader 4 Client
- Right click into the Chart
- “Indicators list”
- Select the Indicator and delete
MTF Support and Resistance Indicator for MT4 (Free Download)
Click here below to download:
La entrada MTF Support and Resistance Indicator for MT4 se publicó primero en ForexMT4Indicators.com.