
Introduction to the Psychological Indicator
The Psychological Indicator is an oscillator type of indicator which indicates momentum and trend direction, as well as overbought and oversold price levels and its corresponding possible mean reversals.
It uses a unique method in which it compares the number of instances price has moved up or down and calculates it in percentage form.
What is the Psychological Indicator?
This indicator plots a blue line which oscillates within the range of zero to 100 with markers at 25, 50, and 75. These markers are used to identify oversold and overbought levels, as well as trend direction.
The line this indicator plots is also characteristically very jagged and moves in a manner which resembles staircase steps.

How the Psychological Indicator Works?
The Psychological Indicator uses a formula that computes for the ratio between the number of upward price movements over the last n periods and the n periods. This number is then multiplied by 100 to normalize it to the range of zero to 100.
Psychological Line = (Upward Movement in the last n periods / n periods) x 100
How to use the Psychological Indicator?
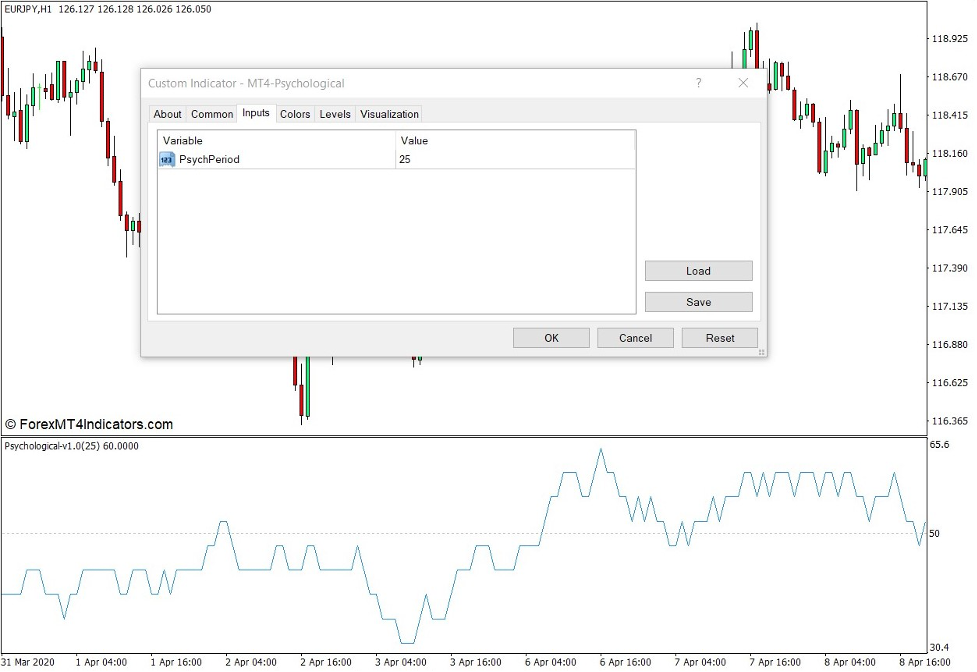
The Psychological Indicator has one variable which modifies the sensitivity of the indicator.
The “PsychPeriod” variable refers to the number of n periods used within the Psychological Indicator’s formula.
Using the middle marker of the Psychological Indicator, which is 50, this indicator can be used to identify trend direction. The Psychological Indicator line usually plots above 50 whenever the market is in an uptrend and below 50 whenever the market is in a downtrend. However, it also crisscrosses the 50 level whenever the market is not trending.
It can also be used to identify overbought and oversold levels and its corresponding mean reversals using the 25 and 75 marker levels. A psychological line above 75 indicates an overbought market, while a line dropping below 25 indicates an oversold market. Both market scenarios are prime conditions for a possible mean reversal.
Buy Trade Setup
When to Enter?
Wait for the Psychological Indicator line to drop below 25. Open a buy order on the confluence of a bullish reversal pattern and the line crossing back above 25. Set the stop loss on the support below the entry candle.
When to Exit?
Close the trade as soon as price action shows signs of a bearish reversal.

Sell Trade Setup
When to Enter?
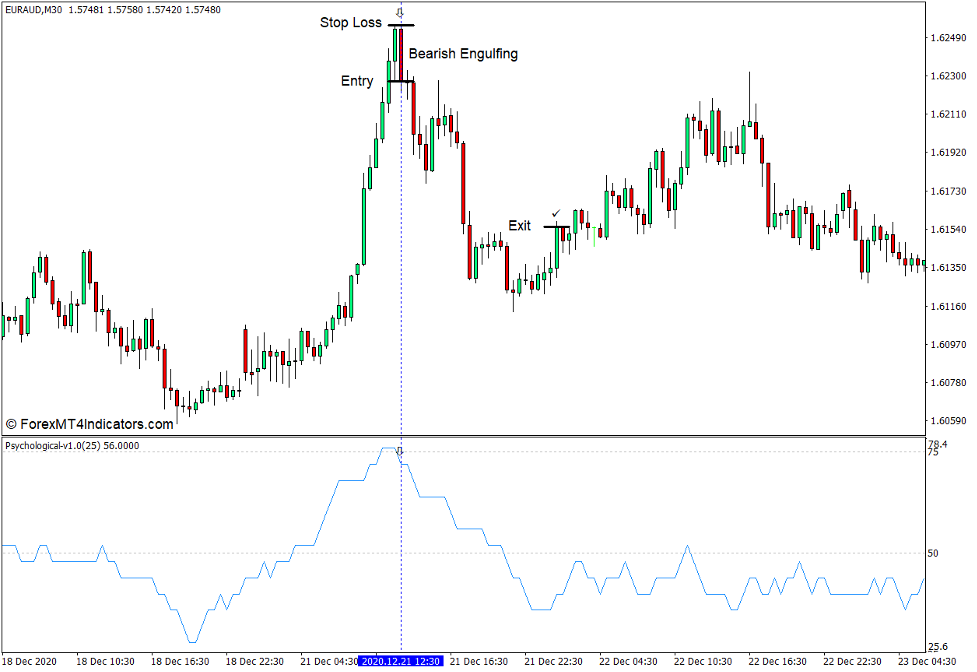
Wait for the Psychological Indicator line to breach above 75. Open a sell order on the confluence of a bearish reversal pattern and the line crossing back below 75. Set the stop loss on the resistance above the entry candle.
When to Exit?
Close the trade as soon as price action shows signs of a bullish reversal.
Conclusion
This indicator can be an excellent indicator for identifying trend direction based on whether the oscillator line is generally above 50 or below it. However, it might not always be accurate as a trend reversal signal as this line may crisscross 50 on non-trending markets.
Where this indicator shines is as a mean reversal indicator trading reversal patterns whenever the line breaks beyond the range of 25 to 75.
MT4 Indicators – Download Instructions
Psychological Indicator for MT4 is a Metatrader 4 (MT4) indicator and the essence of this technical indicator is to transform the accumulated history data.
Psychological Indicator for MT4 provides for an opportunity to detect various peculiarities and patterns in price dynamics which are invisible to the naked eye.
Based on this information, traders can assume further price movement and adjust their strategy accordingly. Click here for MT4 Strategies
Recommended Forex Metatrader 4 Trading Platform
- Free $50 To Start Trading Instantly
- Deposit Bonus up to $5,000
- Unlimited Loyalty Program
- Awards Winning Trading Broker

Click Here for Step By Step XM Trading Account Opening Guide
How to install Psychological Indicator for MT4.mq4?
- Download Psychological Indicator for MT4.mq4
- Copy Psychological Indicator for MT4.mq4 to your Metatrader Directory / experts / indicators /
- Start or restart your Metatrader 4 Client
- Select Chart and Timeframe where you want to test your MT4 indicators
- Search “Custom Indicators” in your Navigator mostly left in your Metatrader 4 Client
- Right click on Psychological Indicator for MT4.mq4
- Attach to a chart
- Modify settings or press ok
- Indicator Psychological Indicator for MT4.mq4 is available on your Chart
How to remove Psychological Indicator for MT4.mq4 from your Metatrader Chart?
- Select the Chart where is the Indicator running in your Metatrader 4 Client
- Right click into the Chart
- “Indicators list”
- Select the Indicator and delete
Psychological Indicator for MT4 (Free Download)
Click here below to download:
La entrada Psychological Indicator for MT4 se publicó primero en ForexMT4Indicators.com.