
Introduction to the Smoothed RSI Indicator
The Smoothed RSI Indicator is an oscillator type of indicator which detects trend and momentum direction. It is an oscillator which is derived from the Relative Strength Index (RSI), with a smoothening characteristic added.
What is the Smoothed RSI Indicator?
This indicator plots a line which oscillates within the range of zero to 100. It also has a marker at level 50. The line typically stays above 50 whenever the market is in an uptrend and below 50 whenever the market is in a downtrend.
The color of the line also changes color to indicate trend direction or bias. It plots a lime line to indicate a bullish trend and a red line to indicate a bearish trend.

How the Smoothed RSI Indicator Works?
The Smoothed RSI Indicator plots an oscillator which is derived from the RSI. It basically plots an oscillator which is a moving average of the RSI. This indicator is preset to calculate a 5-bar Linear Weighted Moving Average (LWMA), but traders can modify these parameters to adjust its sensitivity.
How to use the Smoothed RSI Indicator for MT4
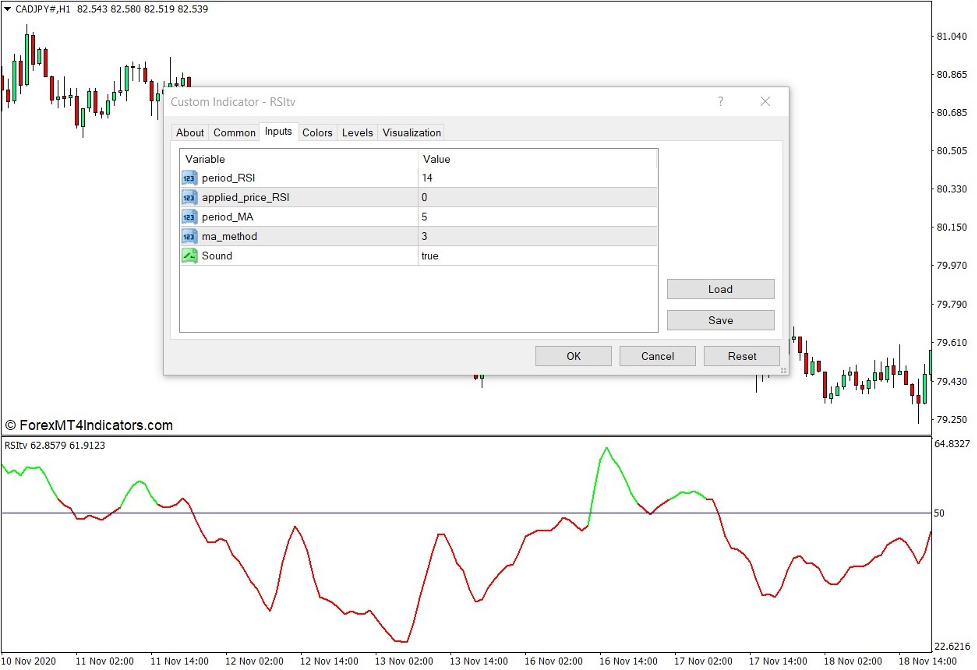
This indicator has several setting options which can adjust the oscillators responsiveness to price movements.
The “period_RSI” variable adjusts the number of bars the indicator uses for its RSI.
The “applied_price_RSI” allows users to change the price point on each bar which the indicator uses for its RSI computation. At “0”, this indicator is preset to use the close of each bar.
The “period_MA” variable adjusts the number of periods the indicator uses to compute for the moving average of the RSI.
The “ma_method” option allows users to change the type of moving average computation used. Using option “3” sets the indicator to use the LWMA method.
This indicator can be used just as a typical RSI indicator. Users can detect trend direction based on where price generally is in relation to its midline – 50.
Traders can also use it to trade mean reversals based on the line reversing strongly after being overextended far from 50.
It can also be used to trade trend continuations based on price dipping back to 50 and bouncing back in the direction of the trend.
Buy Trade Setup
When to Enter?
The line should generally be above 50. Wait for the line to pullback near 50. Open a buy order as soon as the line bounces above 50 in confluence with a bullish candlestick pattern. Set the stop loss below the pattern.
When to Exit?
Close the trade as soon as price action shows signs of a bearish reversal.

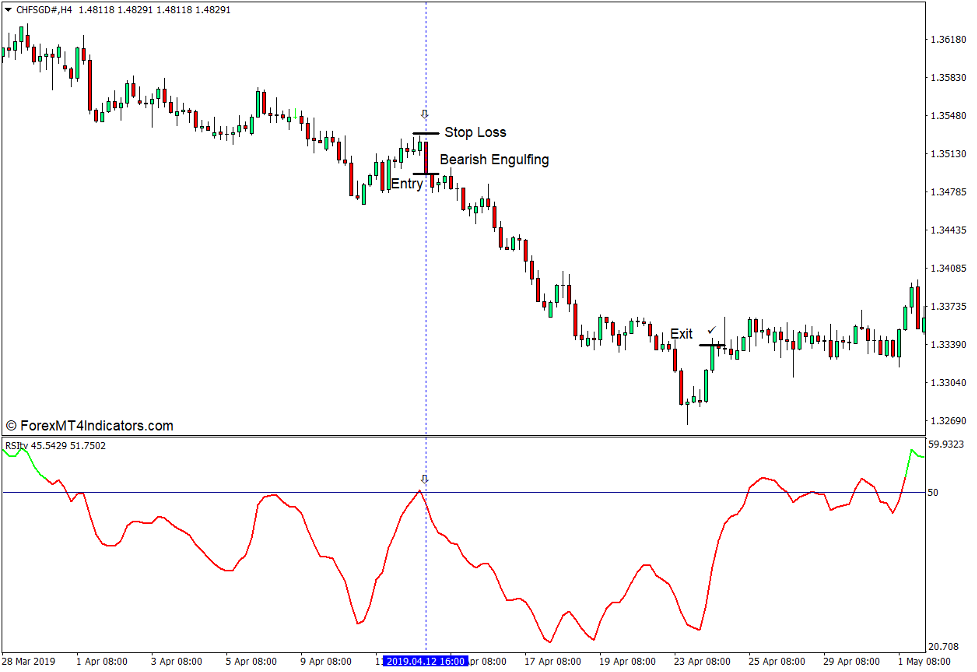
Sell Trade Setup
When to Enter?
The line should generally be below 50. Wait for the line to pullback near 50. Open a sell order as soon as the line bounces below 50 in confluence with a bearish candlestick pattern. Set the stop loss above the pattern.
When to Exit?
Close the trade as soon as price action shows signs of a bullish reversal.
Conclusion
This indicator can be a very useful trend or momentum following oscillator. Unlike the regular RSI, this indicator tends to be very smooth which significantly decreases false signals. Using a low period on the moving average also allows it to stay responsive, making the signals it produce relevant and timely.
MT4 Indicators – Download Instructions
Smoothed RSI Indicator for MT4 is a Metatrader 4 (MT4) indicator and the essence of this technical indicator is to transform the accumulated history data.
Smoothed RSI Indicator for MT4 provides for an opportunity to detect various peculiarities and patterns in price dynamics which are invisible to the naked eye.
Based on this information, traders can assume further price movement and adjust their strategy accordingly. Click here for MT4 Strategies
Recommended Forex Metatrader 4 Trading Platform
- International broker with 24/7 support.
- Over 12,000 assets, including Stocks, Indices, Forex.
- Fastest order execution and spreads from 0 pips.
- Bonuses up to $50,000 starting from the first deposit.
- Demo accounts for testing trading strategies.

Click Here for Step By Step RoboForex Trading Account Opening Guide
How to install Smoothed RSI Indicator for MT4.mq4?
- Download Smoothed RSI Indicator for MT4.mq4
- Copy Smoothed RSI Indicator for MT4.mq4 to your Metatrader Directory / experts / indicators /
- Start or restart your Metatrader 4 Client
- Select Chart and Timeframe where you want to test your MT4 indicators
- Search “Custom Indicators” in your Navigator mostly left in your Metatrader 4 Client
- Right click on Smoothed RSI Indicator for MT4.mq4
- Attach to a chart
- Modify settings or press ok
- Indicator Smoothed RSI Indicator for MT4.mq4 is available on your Chart
How to remove Smoothed RSI Indicator for MT4.mq4 from your Metatrader Chart?
- Select the Chart where is the Indicator running in your Metatrader 4 Client
- Right click into the Chart
- “Indicators list”
- Select the Indicator and delete
Smoothed RSI Indicator for MT4 (Free Download)
Click here below to download:
La entrada Smoothed RSI Indicator for MT4 se publicó primero en ForexMT4Indicators.com.